Creating batch process models such as fermentation is challenging due to their inherent time variability batch to batch. It’s also critical to know when problems are beginning to develop when corrective measures can be taken. Emerson’s David Rehbein, a Senior Data Management Solutions consultant, recently gave an IFPAC presentation, Batch Analytics Applied to a Fermentation Process.
Dave highlighted his work with a nutritional supplement manufacturer and their fermentation process. The process began by analyzing all of the key control loops and adjusting the tuning settings for the temperature and dissolved oxygen to improve the level of basic process control. Through the course of the project team’s work, they found that the critical quality parameters were dependent on several process parameters including inoculation conditions, level of antifoam addition, and dissolved oxygen levels.
The goal in tracking these parameters was to provide the operators with early fault detection to make the adjustments necessary to keep the fermentation process on track and within specifications.
Dave provided a batch analytics overview including the multivariate methods and batch analytics concepts. The primary multivariate methods include principal component analysis (PCA) and projections to latent structures (PLS). PCA provides a concise overview of a data set. It is powerful for recognizing patterns in data: outliers, trends, groups, relationships, etc. The aim of PLS is to establish relationships between input and output variables and developing predictive models of a process.
For the project, analytics models were defined for a batch stage. ISA-88 (S88) defines a stage as
…a part of a process that usually operates independently from other process stages and that usually results in a planned sequence of chemical or physical changes in the material being processed.
For each stage, the inputs and outputs used in the analysis may be different.
Given the time variability of fermentation batches when comparing them, the technique of dynamic time warping (DTW) was used to normalize these differences. This DTW technique comes from the field of voice recognition technology. The analytic process models were developed by incorporating the history of process measurement and lab analysis over the last year. These models were compared against the process operations including the starting conditions of the batch and the process measurement collected during the execution of the batch.
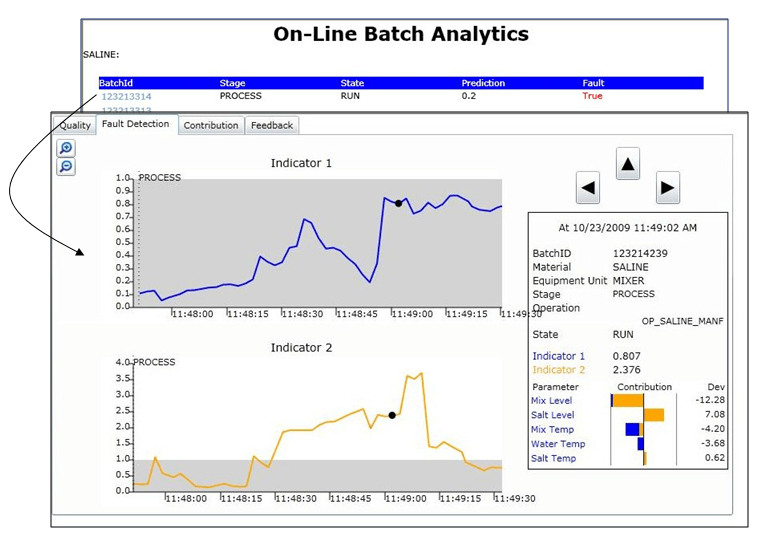
 From an operator interface perspective, this real-time evaluation process fed a predicted end-of-batch quality trend graph for key quality parameters. The analytics also fed a fault-detection trend chart to identify anomalies as soon as they were predicted.
Dave shared an example of a process problem that the analytics could help uncover. The example used was a simulation for a saline solution production process. In the simulation, the model helped to identify a bridge in the salt bin. This bridge condition causes the reduction of flow of salt to the screw feeder, which impacts the final product concentration. It is detected as an unexplained deviation.
Reduced salt flow is reflected by a less than normal change in mixer level while the salt feeder is turned on. The reduction in salt flow is also reflected in the smaller than normal change in salt bin level.
By spotting this bridge condition early, the operators could clear up the condition and restore the correct salt concentration to keep the quality parameters of the fermentation saline solution process within specification limits.
Similar results were achieved for the fermentation process in the detection of a faulting sensor. The model was also able to provide an accurate prediction of the end of batch value for a critical quality attribute of the fermentation process.
