Laurie opened by describing different ways digitalization is described—Industrial Internet of Things, Industry 4.0, and Digital Transformation to name a few. These technologies can help meet new regulation, keep up with the increasing pace of market changes and address disruptive technologies that quickly interrupt the status quo.
Industry 4.0 includes automation and data exchange in manufacturing technologies and includes innovations such as cyber-physical systems, Internet of Things, cloud computing and cognitive computing. Digital Transformation includes the re-examination and reformation of existing business processes to fundamentally improve performance.
Today, most existing plants are vastly under-automated. The generational shift means less experience and people to do the same work. Sensing technologies have advanced to include easy to add wireless devices and analytical techniques have improved to automate the analysis typically performed by those with deep knowledge.
The key to advancing a digitalization project is to understand your company’s capital project method, understand the drivers for a project, and understand the risks for the project and remaining with the status quo.
A place to begin is to look at the biggest operational headaches that are affecting financial performance. Bridge the gap and seek input and buy-in early. Listen to complaints from operations personnel which are often opportunities in disguise.
Some problem language you might hear includes:
- Loop won’t run in Auto
- System is crap
- There are too many alarms
- Valve sticks
- Level swings all the time
- Interlocks are all bypassed
- Product is off-Spec
- We just hit our NOx limit
- Why did the heater trip
- Better get another sample
James shared a case study where a fractionator was in equilibrium and the vapor to liquid ratio, vapor feed rate, feed composition, and heat/feed input suddenly would drop by 20% – 30%. This sudden change caused the tower to slump with trays weeping, equilibrium disturbances, and off-spec & lower yield products. Operators tried various ways to compensate.
The solution began by considering alternatives, their cost to implement, and cost for ongoing maintenance. Potential solutions included more operator training, improved control foundation through improved loop tuning, better measurement and final control. Include the “do nothing” scenario and its associated risks and lack of benefits.
Select best solution and present to management. Estimate benefits but don’t oversell them. Better to sand bag and claim better results than anticipated. Estimate the costs to implement and cost to maintain and state all assumptions.
James reinforced the methodology presented by John Dolenc on using the “best operator method” to compare best performance to average performance and doing a gap analysis on the project can do to close the gap.
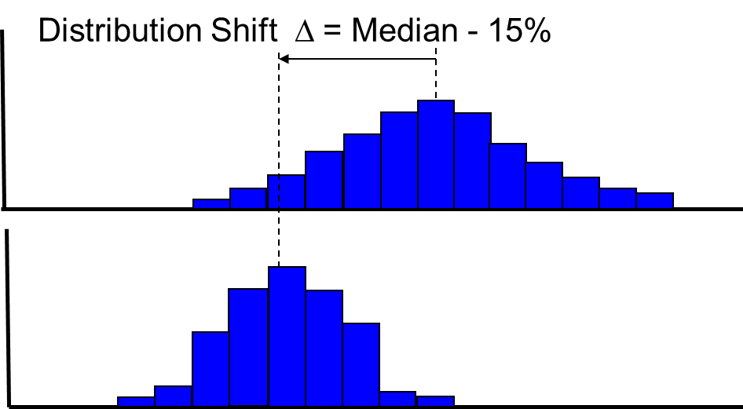
 A second method is the data reduction method where raw data is collected over an appropriate time interval—hourly averages by shift, daily averages, etc. Remove and startup, shutdown and upset data. Normalize this data to a production rate. Plot a histogram. Subtract the values at the median and the 15% points. The differences indicate potential economic benefit.
The third method is the same limit violation methodology. Evaluate current variability and % limit violation. Then, reduce variability with good control (for benefit estimation, 50% reduction in benefit is a reasonable basis).
Based on statistics, calculate the allowed setpoint (SP) shift that will result in the same % limit violation. Calculate value from the SP shift.
Keys to project justification success includes obtaining support of operations and management through a consulting study on opportunity assessment with benefits/cost estimates.
This justification assessment included a review of the process, equipment, problems in order to develop project objectives such as compensation for disturbances, maximization of product production and minimization of product quality variations.
With this data, the next step is to estimate yield and achievable financial results. For the case study they shared, payback on the project was less than a year with a 3.2% increase in yield and increase in revenues from higher quality production.
The project included fixing poorly performing valves, improving measurement accuracy, and implementing a model predictive control (MPC) strategy.
Some of the financial calculations used include return on investment (ROI), net present value (NPV), internal rate of return (IRR), modified internal rate of return (MIRR) to include cash flow reinvested at the company cost of capital, and payback.
One of the most important parts after executing the project is to verify the actual benefits and broadly communicate them to senior management and operations.
Another critical aspect is to maintain the benefits over time. James noted the half-life of benefits without maintenance is typically 6 months. It’s best to plan 10-25% of the original implementation costs annually to maintain the benefits. Over for years this means spending 25% to get 75% versus getting 0% at the end of the 4 years.
For the project cited, James shared the quantified results:
- Reduced quality exceedance frequency by over 30%
- Increase yield of more profitable product by 4.6% vs 3.2% estimated
- Reduced constraint on downstream bottleneck unit
- Obtained over $650K in benefits annually vs estimated $200-$250K in business case
- Payback period was in 6 months vs 1 year (estimated)
Visit the Operational Certainty consulting area of Emerson.com to learn more about ways to help justify, execute and quantify results for process optimization projects.


